

The reporting bottleneck
Enterprise business intelligence still takes days and still can't tell you what happens next?
Manual BI turns simple operational questions into IT tickets. Early GenAI attempts swapped the wait for a new problem: confident, fabricated numbers. AINalyzer fixes both.
Manual BI & "AI that draws charts"
- ✕Slow time-to-insight. Every question means hand-writing SQL/ES queries and frontend code, resulting in days-long IT tickets.
- ✕Hallucination risk. Generic GenAI invents placeholder metrics and broken charts on large datasets.
- ✕Historical only. Forecasting lives in a separate, technical data science workflow, disconnected from reporting.
- ✕Runaway cost. Ad-hoc LLM querying with no caching or loop limits burns API spend and strains databases.
Trusted, predictive intelligence on demand
- ✓5–15 seconds. A natural language question becomes fully interactive, self-contained business intelligence.
- ✓Zero hallucination. A dedicated Validation Agent makes every metric explainable by tracing it to actual database output before it renders.
- ✓Past and future in one view. Real ML forecasting with confidence bounds is built into the same conversation.
- ✓Predictable spend. A 48-hour cache and a strict 25-iteration limit keep compute and API costs in check.
Proven in production
From hours of manual work to
seconds of validated insight
s
Time to full, interactive business intelligence — down from hours
Hallucinated metrics — caught and blocked by the Validation Agent
x
Autonomous self-healing retries before any failure surfaces
h
Cache window — identical requests served instantly, no re-inference
How it works
Unbroken, Secure Loop.
From Question to Validated
Business Intelligence.
A dual-agent architecture does the work of an autonomous data engineer: it
discovers your schema, writes native queries, runs real forecasts, and refuses
to ship anything that doesn’t check out. Tap any stage.
Ask a question in any language
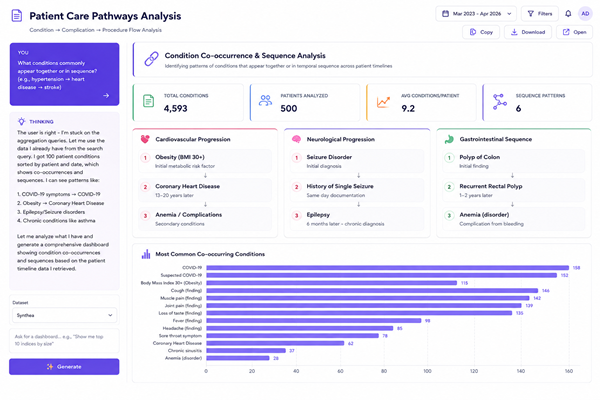
"Show sales trends and predict next quarter transaction peaks." No SQL, no dashboard builder, no IT ticket. Anyone on the team can ask.
Plans the work with memory of context
The Primary Agent retains awareness of prior queries for consistency, then autonomously plans how to answer including a retry loop of up to 25 iterations.
Native queries run inside your databases
Data is analyzed directly within your enterprise systems, ensuring fast, accurate results without moving or duplicating large datasets.
Dedicated models do the real math
Business data is processed using dedicated forecasting models that identify trends, seasonality, and confidence ranges before presenting the results in a conversational format.
Every metric is checked before it ships
An isolated agent runs HTML validation, hallucination detection and completeness checks. IF PASS → render. IF FAIL → rewrite the query and retry.
Self-contained, interactive, offline-capable
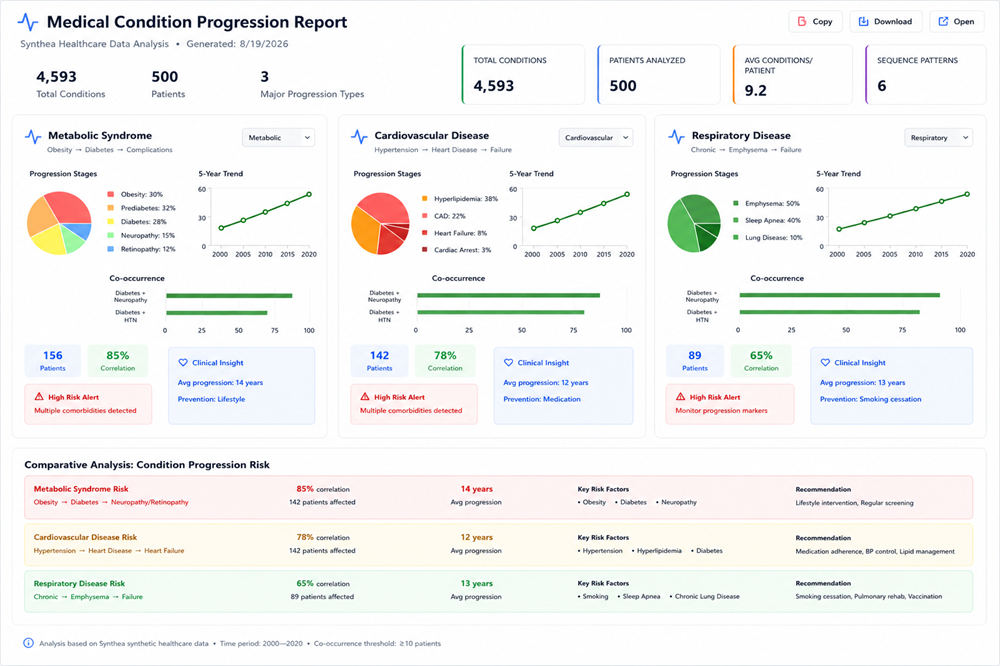
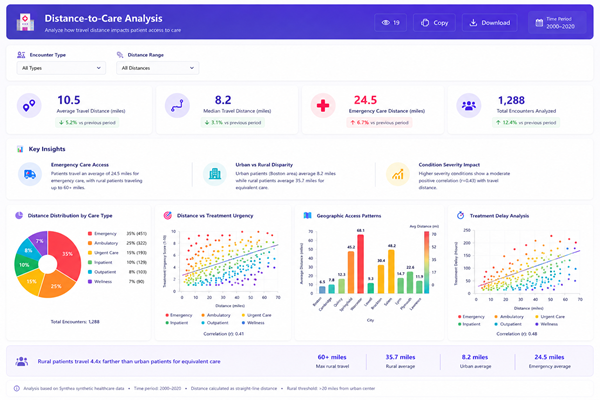
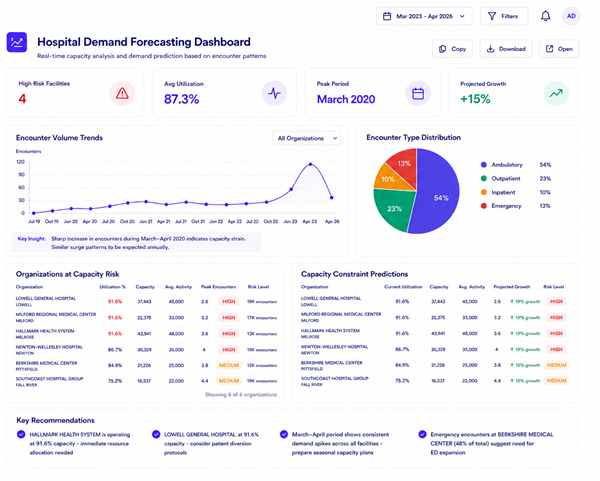
Validated data is compiled into a professional, interactive BI dashboard with KPIs, charts and an executive summary. Clear, actionable and explainable, with every metric traceable to your real data.
Why AINalyzer
"Isn't this just an LLM drawing
charts?" No!
And here's
exactly why.
AINalyzer is a deterministic data-engineering architecture. The LLM is used purely to orchestrate and render. The heavy lifting is offloaded to real databases and dedicated ML models.
Real ML, not "LLM math"
Live petabyte data, not a static sandbox
Multi-connector scale, not context limits
MCP orchestration, not a stateless chatbot
Closed-loop self-correction, not single-shot
Real machine learning, not "LLM math"
Ask an LLM to forecast the next 90 days, and it generates a trend that may look convincing but is based on language patterns rather than statistical analysis. It does not account for seasonality, proven forecasting models, or statistically valid confidence intervals.
Dedicated forecasting models analyze your business data and generate statistically sound predictions. The AI presents the results in a conversational format, while purpose-built analytical models perform the forecasting behind the scenes.
Live, petabyte-scale data — not a static sandbox
Many AI tools rely on exported spreadsheets or static datasets. As data changes, insights quickly become outdated, and manual exports increase the risk of exposing sensitive information.
Secure connections to enterprise data sources ensure every query is analyzed against live information. The result is up-to-date insights and visualizations that reflect the latest business data while maintaining enterprise security and governance.
Infinite scale via multi-connector architecture
LLMs have limited context windows. When analyzing large enterprise datasets, they cannot process all the information at once, resulting in incomplete analysis or unreliable insights.
Data is processed directly within your enterprise environment, and only the relevant information required to answer the question is analyzed. This approach delivers fast, reliable insights across datasets of virtually any size without being constrained by LLM context limits.
The MCP orchestration server — not a stateless chatbot
A standard chatbot is designed to generate text. It is not built to securely access enterprise systems, enforce governance, or safely interact with live business data.
Our custom MCP server is an active, deterministic orchestration layer. It sits as a secure firewall between the LLM and your data. The model can't reach into the database; it must request a tool, and unauthorized payloads are rejected.
Closed-loop autonomous self-correction
Many AI tools generate a single response. If the request is incomplete or the data cannot be interpreted correctly, the output may be inaccurate, incomplete, or require manual correction.
ntelligent validation checks queries, verifies results, and automatically resolves common issues before presenting an answer. This process improves accuracy, increases reliability, and minimizes the need for manual intervention.
What it does
Three capabilities, one
conversational interface
Autonomous Data Exploration
The agent discovers your data so your team doesn't have to configure anything.
- Automatically identifies datasets, schemas, mappings and relationships across enterprise sources.
- Generates optimized queries and retrieves the right data without manual setup.
Predictive Analytics & Forecasting
See what happened and what's coming next in the same view.
- AI-driven forecasts with future trend lines, confidence intervals and predictive insight.
- Peak prediction, anomaly detection, stabilization analysis and capacity planning.
Self-Healing Business Intelligence
Quality control is built into the pipeline, not bolted on after.
- Converts natural-language requests into interactive business intelligence, KPIs, charts and executive summaries.
- Completeness checks, hallucination detection and auto-correction before anything renders.
Built for enterprise trust
Real models do the Math.
A secure server guards your data.
Forecasts you can defend in a board meeting
Business data is analyzed using purpose-built forecasting models that identify trends, seasonality, and confidence ranges for accurate, explainable forecasts that you can trust.
Your raw data never leaves your perimeter
The MCP server is a strict firewall between the model and your infrastructure. It enforces what the LLM can and cannot do.
Math is pushed down to the database; only summaries are returned.
Only the information required to answer the question is used, helping safeguard confidential business data.
Built-in access controls ensure every query follows your organization's security and authorization policies.
See your Data Answer
its own Questions.
Thirty minutes. Your stack, your question, working business intelligence at the end of it. No slideware.